This is a very user-friendly app. You just need to upload the input files, and then click “Ejecutar”:
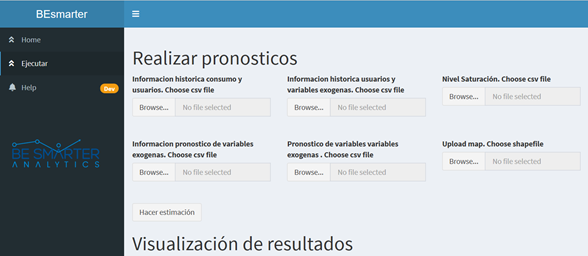
Input files by row are:
- 1. Historical information of total consumption and amount of customers.
- 2. Historical information of exogenous variables that drive consumption and amount of customers.
- 3. Maximum capacity of customers per analytical region. This level can be set by the local council.
- 4. Customers’ drivers scenario in the forecast period.
- 5. Average consumption’ drivers scenario in the forecast period.
- 6. Maps of the analytical regions.
Once the input files are uploaded, then our app estimates and forecasts the spatio-temporal models.
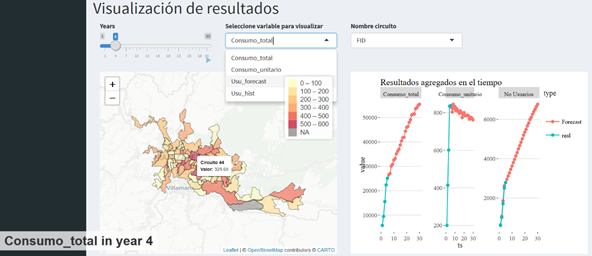
You can see that our app is dynamic and interactive:
- 1. Dynamic maps with historical information and forecasts at analytical region for each variable: total consumption, total amount of customers and average consumption.
- 2. Time series associated with each analytical region for ach relevant variable.
- 3. Our clients can download all this information in html or pdf files.